
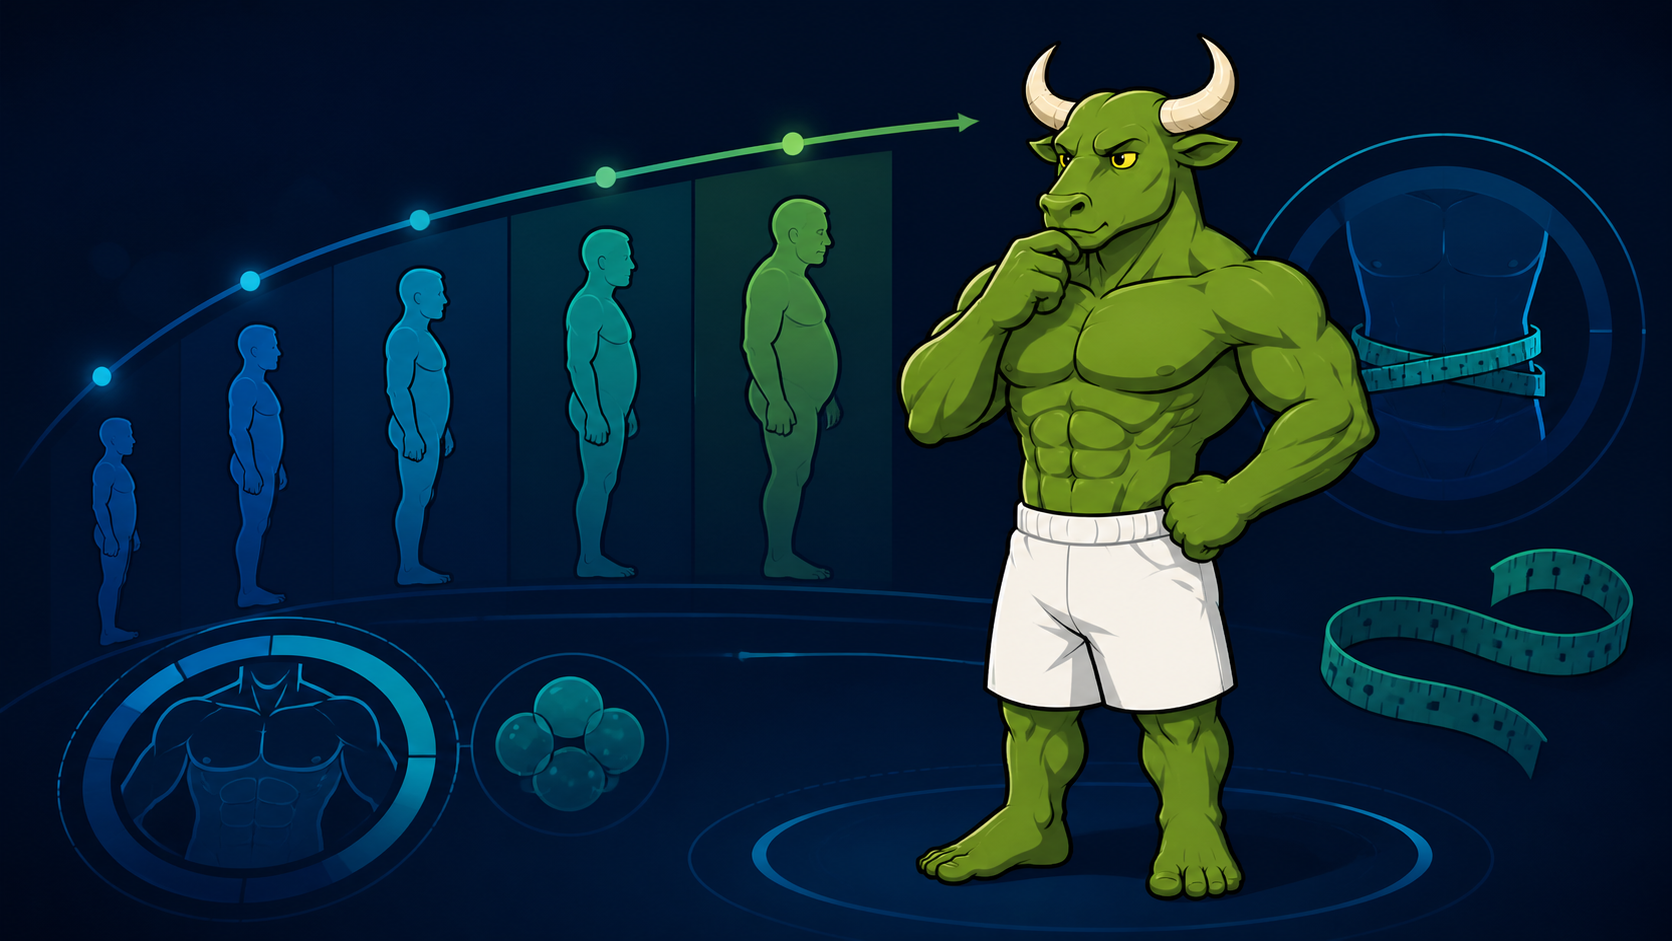
Average Body Fat Percentage by Age: What the Numbers Actually Mean
Average body fat percentage changes with age and differs by sex, but a population average is not a personal goal. Learn how to read age-based tables, understand measurement limits, and track your own trend without treating one number as a diagnosis.
By Reset90 AI Editorial Team
Short answer: Average body fat percentage usually rises across adult age groups, and women generally have higher population averages than men. But an average is not the same thing as a healthy range or a personal target. Use an age-and-sex table as context, then interpret your own result with the measurement method, waist trend, strength, photos, and other health signals in view.

01What does average body fat percentage by age actually mean?
When someone searches for the average body fat percentage by age, they are usually looking for a reference point: “How does my number compare with other people my age?” That is a reasonable first question, but the answer is easy to misuse.
A population average describes a group. It does not tell you whether a particular person is healthy, athletic, unhealthy, or making progress. A healthy reference range is a guideline used to provide context. A personal target is a practical range you choose with your goals, history, performance, and professional guidance in mind. Those three numbers may be very different.
Body-fat estimates also depend on how they were produced. A DXA scan, a skinfold assessment, a smart scale using bioelectrical impedance, and a visual estimate are not interchangeable instruments. Even when two methods use the same percentage, they may not be measuring the same thing with the same error.
02Average body fat percentage by age and sex
The table below is a commonly cited U.S. population reference based on CDC/NHANES-style adult data. It is useful for seeing the direction of the averages, not for assigning yourself a pass-or-fail grade.
| Age group | Men: population average | Women: population average |
|---|---|---|
| 20–39 | About 26.1% | About 37.8% |
| 40–59 | About 28.6% | About 40.5% |
| 60–79 | About 30.8% | About 42.4% |
| 80 and older | About 30.7% | About 40.4% |
These figures are averages for a defined population and study method. They are not a promise that every 30-year-old man should be close to 26.1%, or that every 65-year-old woman should be close to 42.4%. Averages can also be influenced by the mix of participants, the year of collection, how age is grouped, and how body fat was estimated.
The practical takeaway is the pattern: body-fat averages tend to be higher in later adult age groups, and the female average is higher than the male average. The pattern is useful context. It is not a reason to stop caring about strength, mobility, nutrition, or waist changes as you get older.
03Average vs. healthy range vs. personal target
Search results often place several different types of numbers next to each other. That can make the question feel more precise than it really is. Before comparing your result with a table, identify which kind of number you are reading.
| Type of number | What it answers | What it cannot answer alone |
|---|---|---|
| Population average | What a measured group averaged | Whether your result is healthy or appropriate for you |
| Healthy reference range | Where a guideline places a broad lower-risk context | Your medical status, fitness, or ideal appearance |
| Personal target | What supports your goal and is realistic to maintain | A universal standard for everyone your age |
Some guideline-linked tables place adult men roughly around 8–19% in their 20s and 30s, 11–21% in their 40s and 50s, and 13–24% in their 60s and 70s. Comparable broad ranges for adult women are often shown around 21–32%, 23–33%, and 24–35%. Sources vary, so treat these as orientation rather than diagnostic cutoffs.
Notice what this means: a population average can sit above a guideline-linked healthy reference range without making the average person a diagnosis. It also means a number inside a reference range does not prove that your sleep, blood pressure, strength, blood sugar, or relationship with food is healthy. Body fat is one signal among several.
04Why does body fat tend to change with age?
Adult body composition often changes with age because several forces move together:
- Lean mass can decline without deliberate resistance training. When muscle is not challenged and protein intake or recovery is inconsistent, a person may lose some lean tissue over time.
- Daily movement often falls. Work, commuting, injury, caregiving, and other life changes can reduce the amount of low-intensity movement that used to happen automatically.
- Fat distribution can shift. The location of stored fat may change even when scale weight changes only modestly.
- Life stage and hormones matter. They can influence appetite, recovery, muscle retention, and where weight is carried, but they do not determine one inevitable outcome.
- Training history matters. Two people the same age can have very different body composition because they have different histories of lifting, sport, dieting, illness, and activity.
Age is therefore context, not destiny. A useful goal is not to imitate a younger age group. It is to build a routine that helps you preserve strength, maintain useful movement, eat adequately, and make changes you can repeat.
05Why are men and women shown separately?
Age-and-sex tables are separated because typical body composition differs across the population. Women generally carry a higher essential-fat requirement and have different patterns of fat storage and lean tissue distribution than men. That is why one universal body-fat table would be misleading.
This distinction is about interpreting measurements, not ranking bodies. A female result should not be judged against a male reference table, and a male result should not be treated as abnormal simply because it does not fit a female range. For trans and nonbinary readers, the best reference depends on the purpose of the measurement, the method used, hormone context, and guidance from a qualified clinician when health decisions are involved.
06How to interpret your own body-fat result
If you already have a number, use this sequence before deciding that it means something dramatic.
- Write down the method. Record whether it came from a smart scale, calipers, DXA, an in-person assessment, or an estimate. Do not compare a home BIA result directly with a DXA result as though they were laboratory readings of the same variable.
- Use the same method for a trend. Consistency is usually more useful than chasing the most impressive-looking number. Measure under similar conditions and focus on the direction over several weeks.
- Add waist and body-weight trends. A weekly weight average and a waist measurement can add context, especially when day-to-day water, sodium, digestion, or menstrual-cycle changes obscure the trend.
- Check performance. Are comparable lifts, repetitions, walking tolerance, or conditioning sessions improving, stable, or falling? Strength and function help explain what a scale percentage cannot.
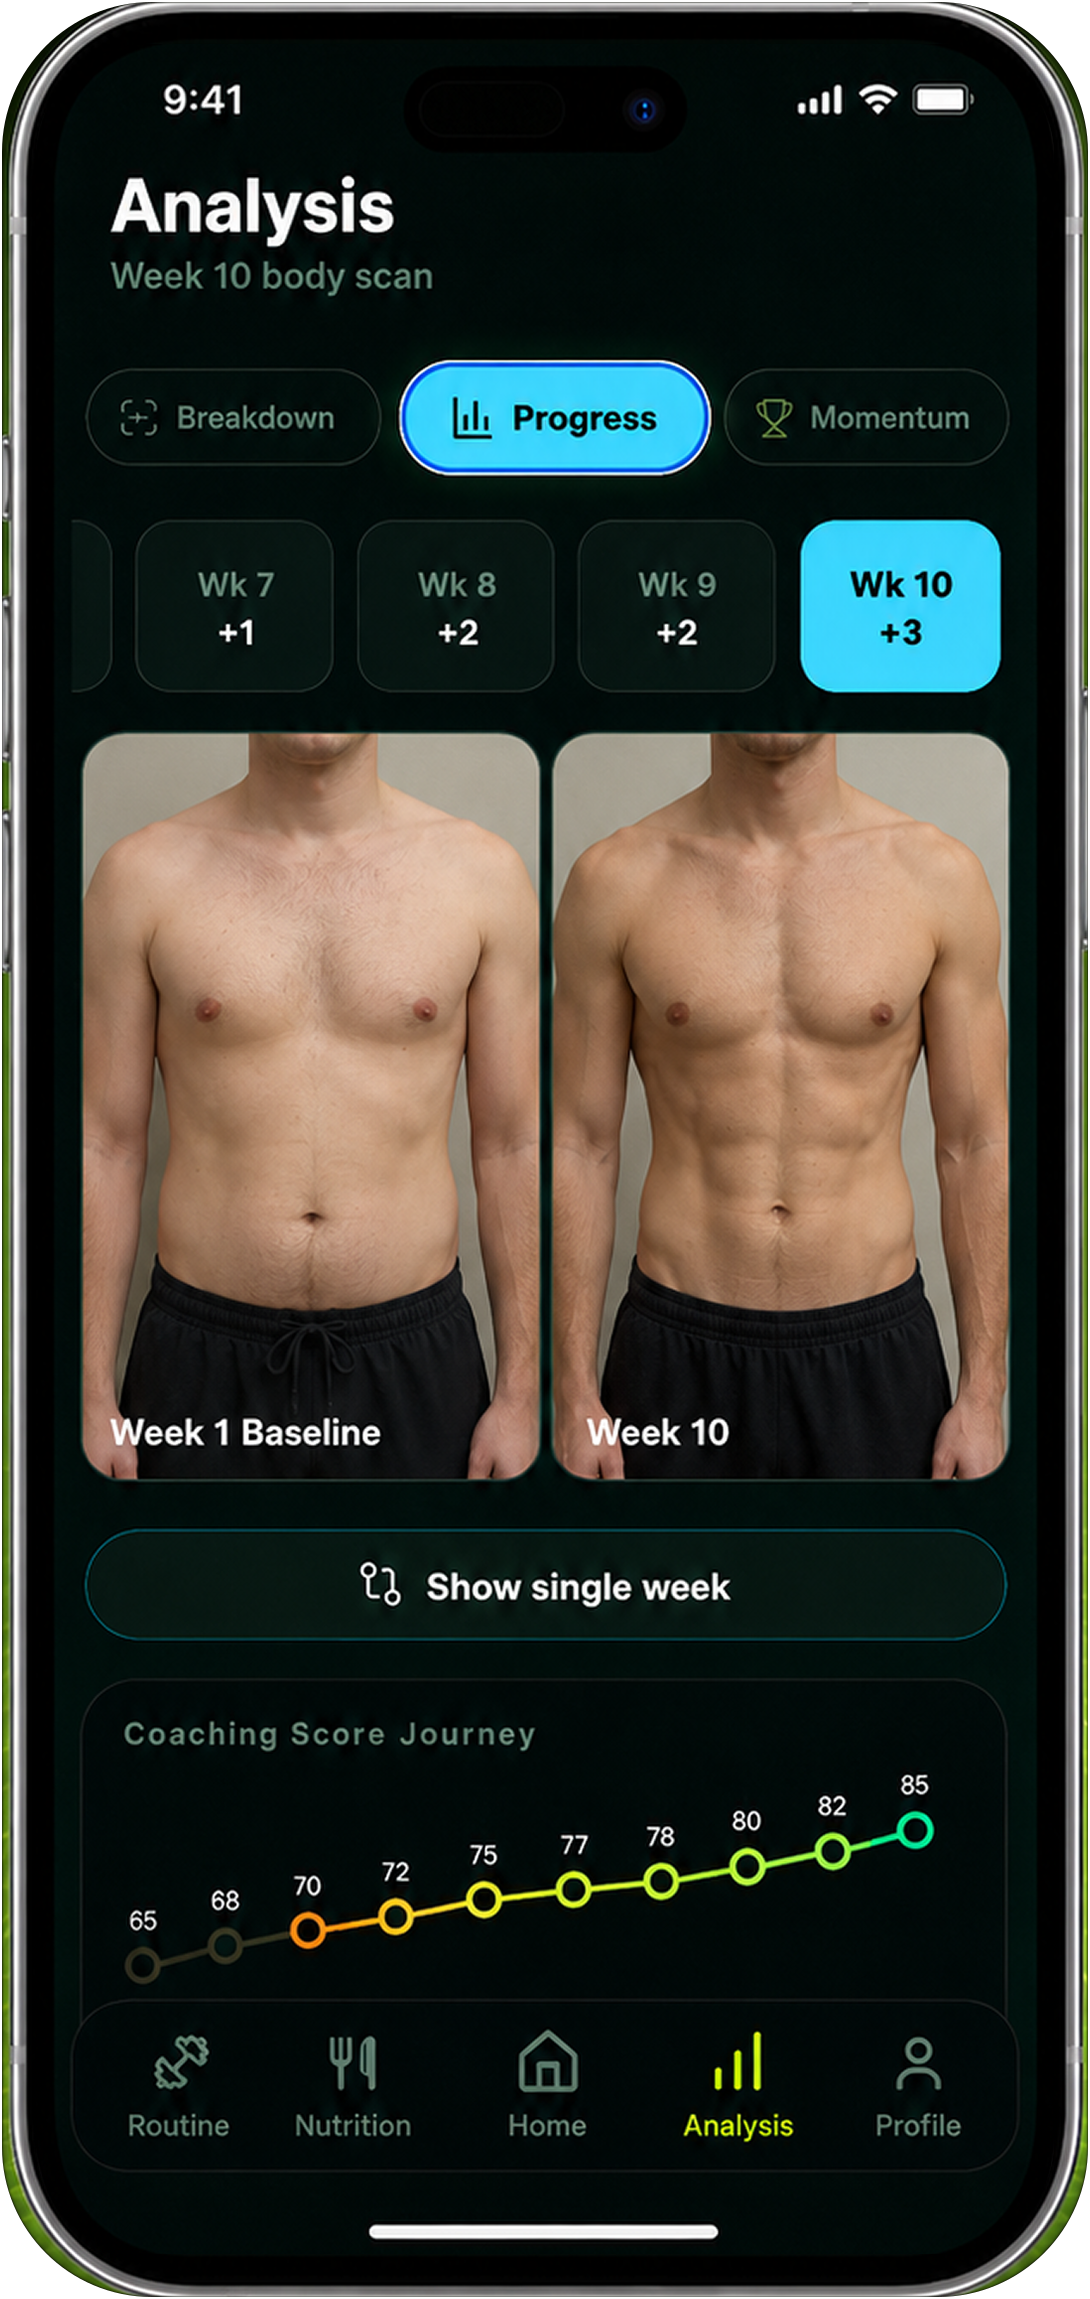
- Use consistent progress photos if they are comfortable for you. Same lighting, distance, clothing, posture, and timing make visual comparison more useful. Photos show appearance and shape, not a direct measurement of body fat.
This is also why one reading should not decide whether a plan is working. Look for a pattern across multiple signals, and change one major variable at a time when possible.
07How accurate are smart scales and other methods?
Every body-fat method has a useful role and a predictable limitation. The question is not simply “Which one is accurate?” It is “What decision can this method support, and can I repeat it consistently?”
| Method | Useful for | Important limitation |
|---|---|---|
| Smart scale or BIA | Convenient repeated home readings | Hydration, food, exercise, skin temperature, and the device's algorithm can move the estimate |
| Skinfolds | Low-cost repeated checks with a skilled assessor | Technique, site selection, and the equation used affect the result |
| DXA | A more detailed clinical or research snapshot | It is still an estimate, can vary by machine and protocol, and is not necessary for every fitness decision |
| Waist, photos, and performance | Low-friction progress context | They do not produce a body-fat percentage and should not be treated as one |
For a smart scale, measurement conditions matter. A reading after a hard workout, a salty meal, dehydration, or a large amount of food may not be comparable with a morning reading taken under different conditions. If the number jumps while your waist, photos, and performance are stable, suspect measurement noise before assuming a sudden change in body composition.
08Average body fat percentage by age vs. BMI
BMI and body-fat percentage answer different questions. BMI uses height and weight. Body-fat percentage attempts to estimate how much of your body weight is fat. Neither one, by itself, tells the full story of muscle mass, fat distribution, fitness, or health.
Someone with substantial muscle may have a high BMI without having the same body-fat pattern as someone who is sedentary. Conversely, a person can have a “normal” BMI while carrying less lean mass than is useful. Our guide to body fat percentage vs. BMI explains the tradeoff between these measures, and is BMI accurate? covers why a population screening tool should not be used as an individual verdict.
Think of the measures as different dashboard lights. The goal is not to make one light carry the whole interpretation.
09A repeatable way to track progress without chasing a chart
A simple weekly review can turn a confusing body-fat table into a calmer decision process:
- Choose a check-in day. Record your weight under similar conditions and note your waist measurement if you are tracking it.
- Keep the method stable. If you use BIA, use the same device and a similar routine. If you use photos, keep the setup consistent.
- Review training. Note whether your key movements, total activity, and recovery are moving in a direction you can sustain.
- Review nutrition adherence. Look at the pattern of meals and protein intake rather than treating one unusually high or low day as a failure.
- Make one small adjustment. If the trend and the goal are misaligned for several weeks, change one manageable behavior and give it enough time to evaluate.
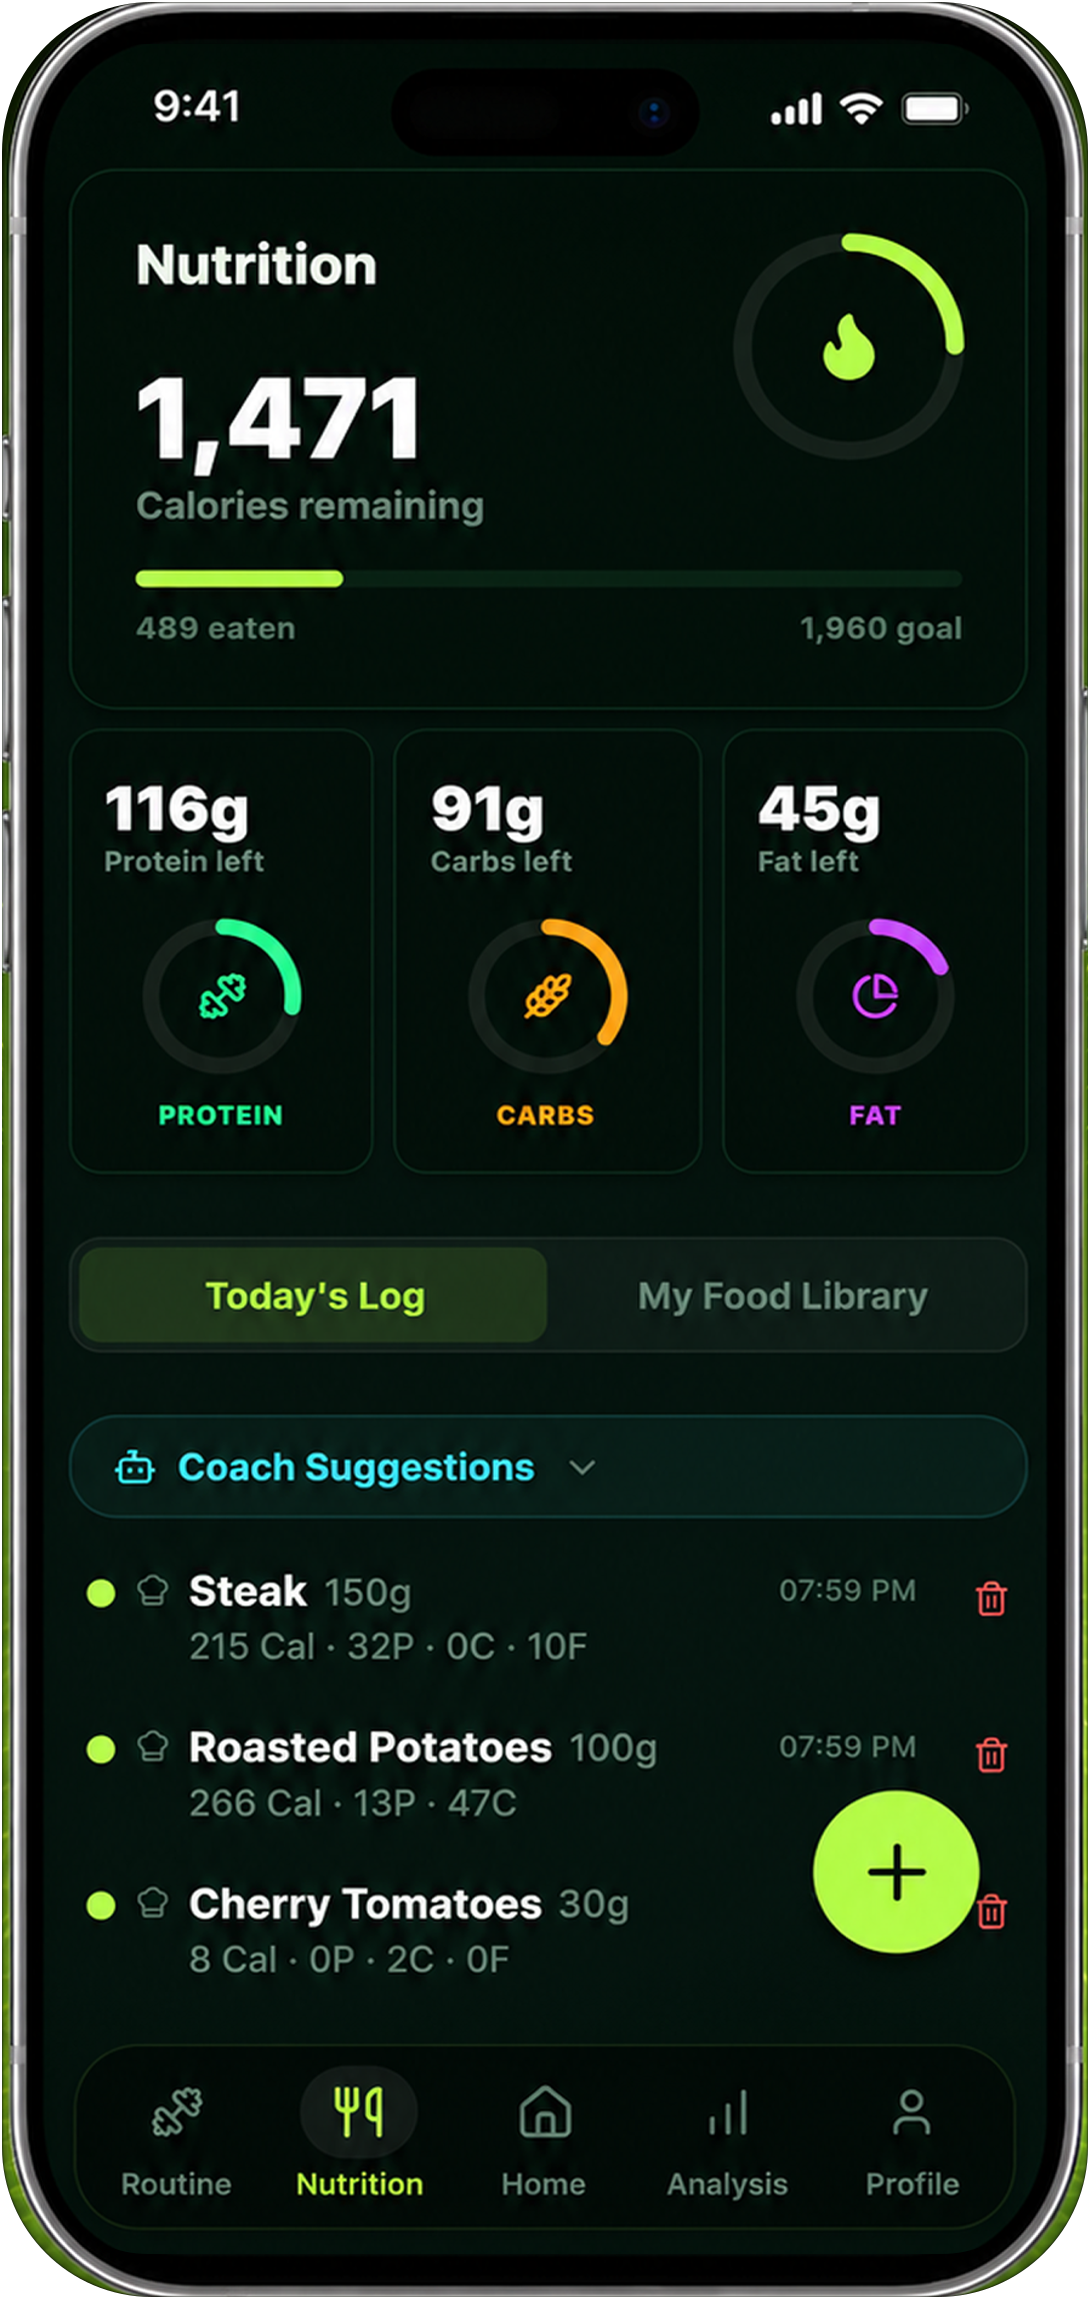
Reset90 can help keep this context together: planned workouts, nutrition targets, check-ins, progress photos, and trend notes can live in the same routine instead of being scattered across separate spreadsheets and apps. Its optional AI body check-in is a visual coaching signal for reviewing progress consistency; it is not a body-fat percentage estimator, diagnosis, or replacement for a clinical measurement.
10Frequently asked questions
What is the average body fat percentage for my age?
For commonly cited U.S. adult population data, averages are roughly 26.1% to 30.8% for men across the 20–79 age groups and 37.8% to 42.4% for women. Your age group, sex, population, and measurement method all matter, so use the table as context rather than a personal score.
Is the average body fat percentage healthy?
Not automatically. An average describes what a group measured, while “healthy” involves broader context. Reference ranges differ by source and are not diagnostic cutoffs. Consider waist, blood pressure, labs when relevant, strength, function, nutrition, and professional assessment alongside body composition.
Does body fat naturally rise with age?
Population averages often rise with age, but that does not make an increase inevitable for every person. Resistance training, daily movement, adequate nutrition, sleep, medical context, and life circumstances all influence the trend.
Are smart scales accurate for body-fat percentage?
Smart scales can be useful for a repeated trend under consistent conditions, but the exact percentage can be affected by hydration, food, exercise, and the device's algorithm. Treat the estimate as one signal, not a precise measurement of your health.
What should I track besides body fat?
Track a small set that you can repeat: weekly weight averages, waist or other measurements, consistent progress photos if comfortable, training performance, daily movement, nutrition adherence, sleep, and how you feel. The best set is the one that helps you make a sensible next decision.
Is this medical advice?
No. This is general fitness education. If you are pregnant, have a history of disordered eating, have unexplained weight change or symptoms, or are making an aggressive body-composition or medication decision, speak with a qualified healthcare professional.
11The bottom line
Average body fat percentage changes with age and differs by sex, but the table is only a reference point. Do not turn a population average into a personal target, and do not let a single home estimate overrule the rest of the picture. Use one repeatable method, compare trends over time, and combine body composition with waist, strength, photos, nutrition, recovery, and professional context when needed.
The most useful question is not “Am I exactly average?” It is “Am I tracking the signals that matter for my goal, and do I know what to adjust next?”
The Reset90 system
Useful ideas for building a body you can keep.
Training notes, product updates, and practical ways to make your next 90 days count.
Start your next 90 days
Get your daily training, nutrition, and check-in priorities in one adaptive system.


Keep reading
Related articles

Ideal Body Measurements for Women
There is no single ideal body measurement set for women. Learn how averages, waist-to-height, body shape and repeatable tracking fit together without chasing a fixed beauty standard.
Read article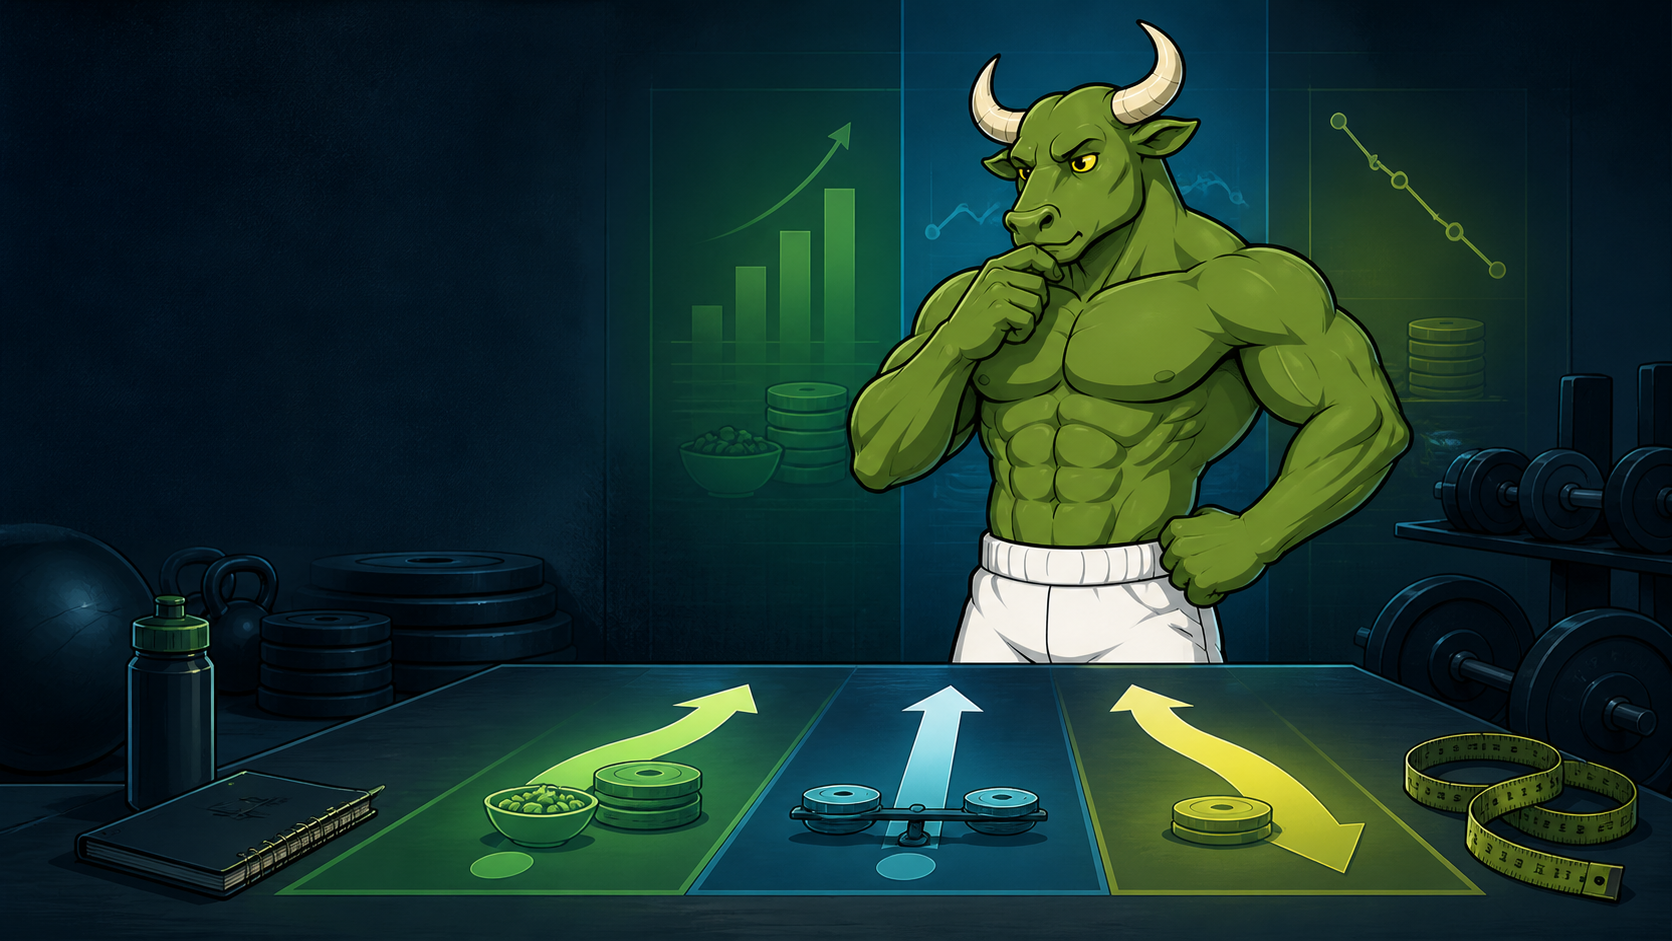
Bulk, Cut, or Recomp? A Practical Decision Guide
A practical way to choose a bulk, cut, recomp, or maintenance phase using your goal, training age, recovery, and repeatable progress signals.
Read article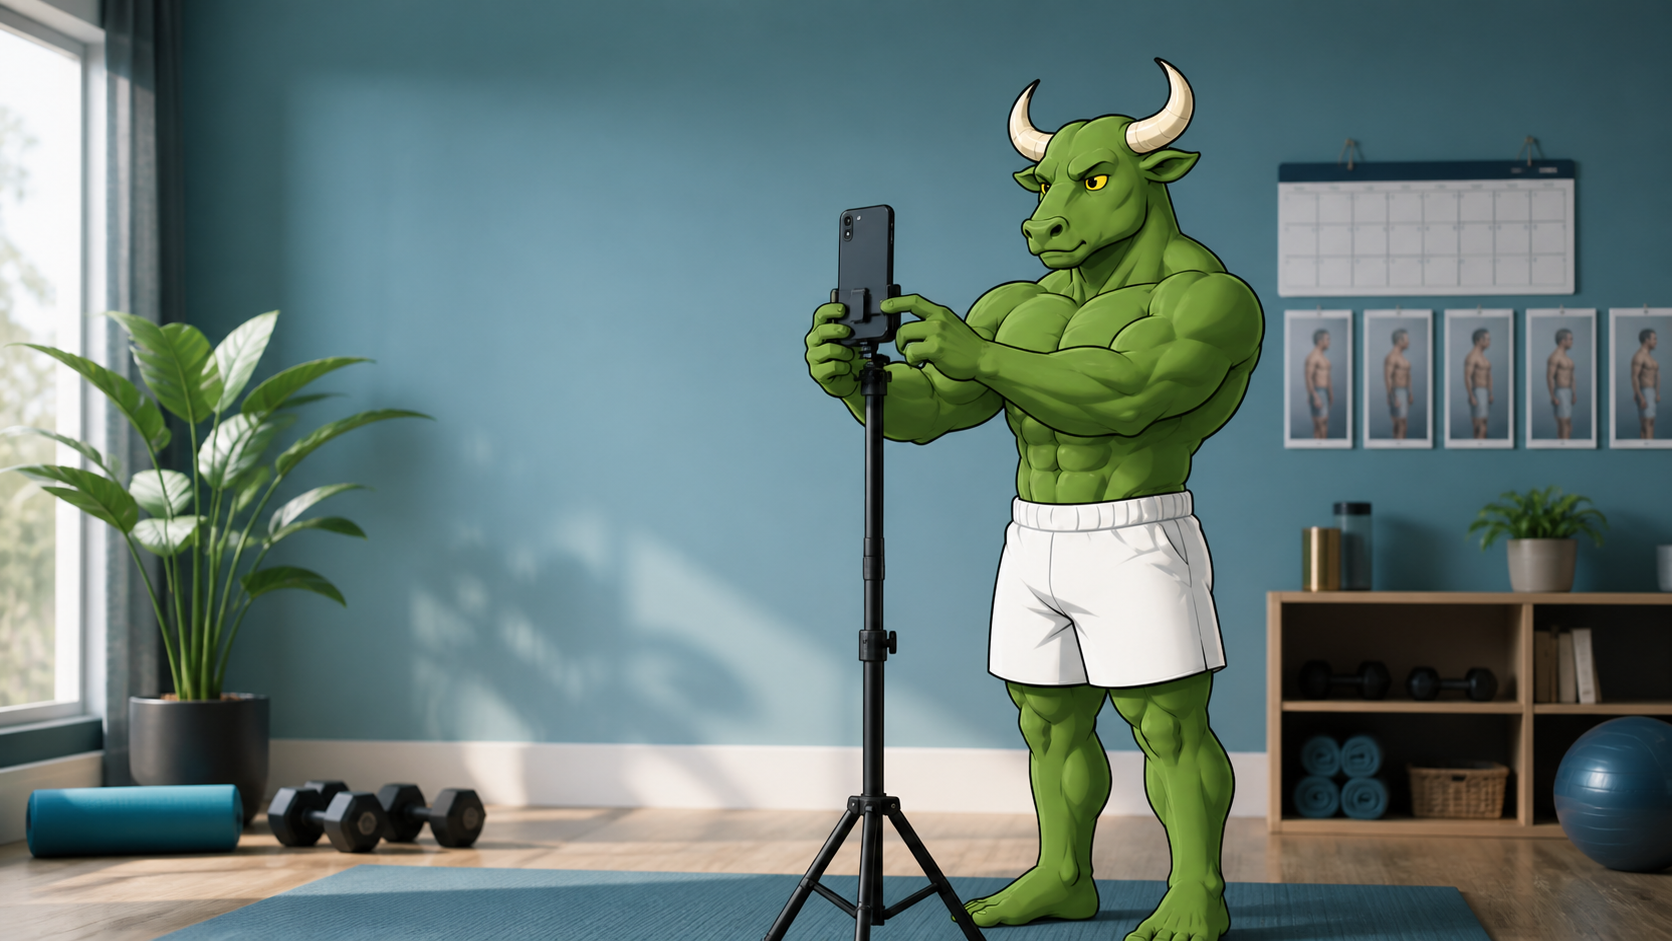
How Often Should You Take Progress Photos?
How often should you take progress photos? Use this goal-based guide to choose weekly, biweekly, or monthly check-ins and make every comparison more consistent.
Read article