
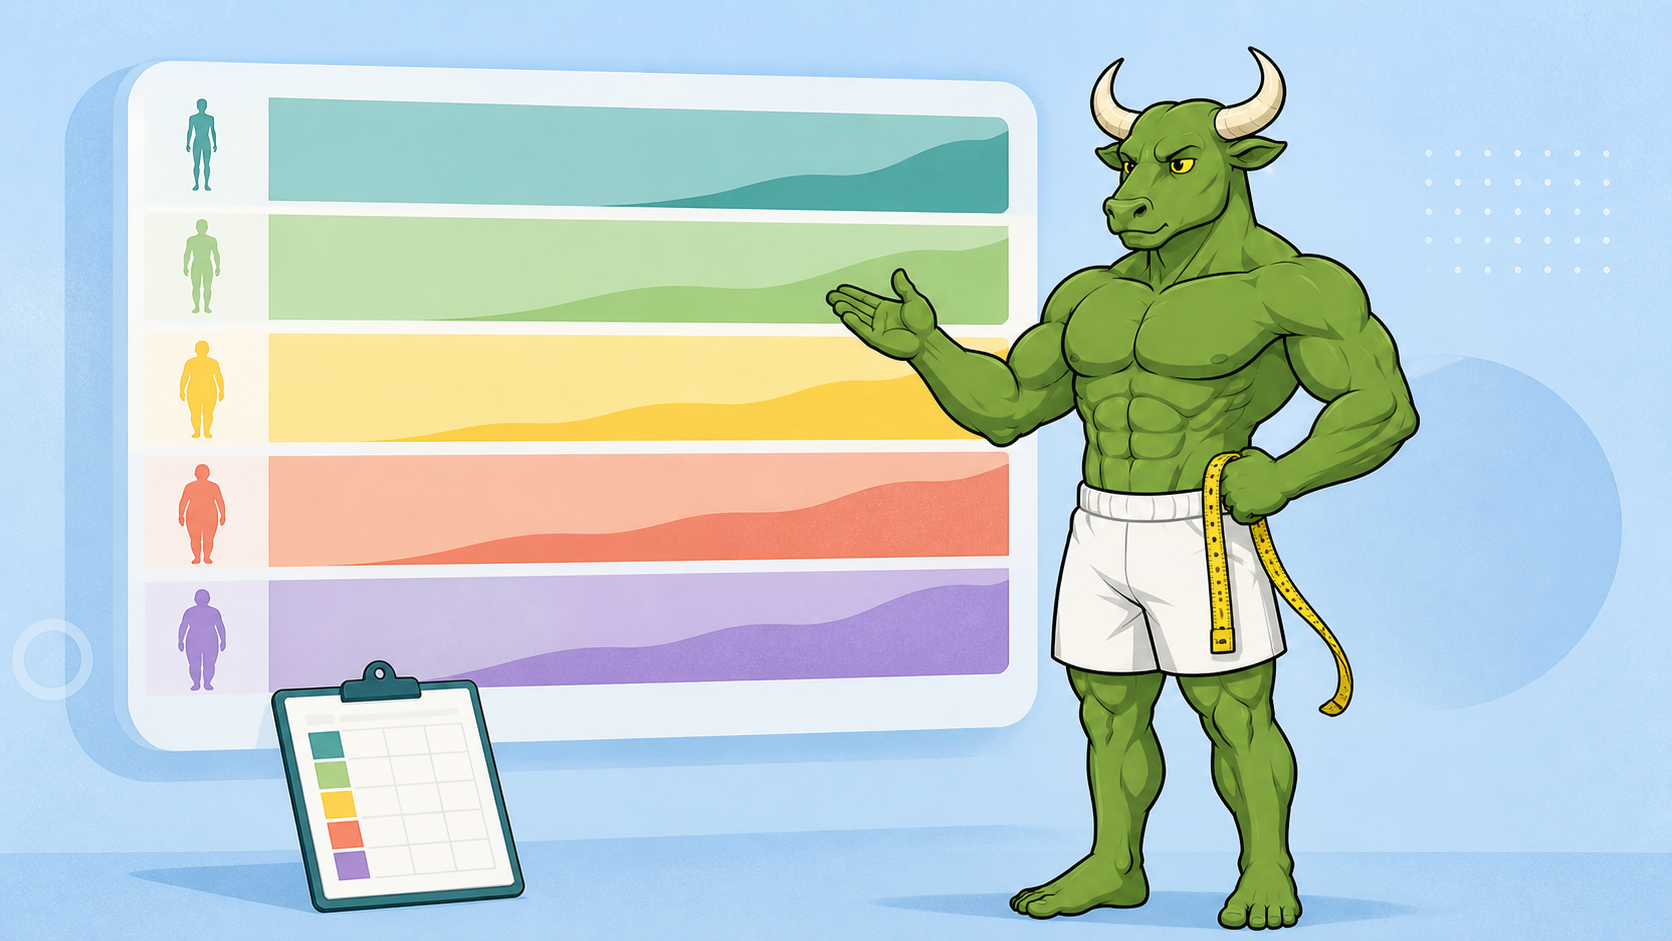
Body Fat Percentage Chart by Age and Sex: How to Read the Ranges
Use this body fat percentage chart by age and sex to understand common ranges, measurement limits, and how to track a real trend without treating one number as a diagnosis.
By Reset90 AI Editorial Team
Short answer: A body fat percentage chart is a reference map, not a diagnosis or a pass/fail score. A commonly used adult chart places essential fat around 2–5% for men and 10–13% for women, with wider athletic, fitness, and average bands above that. The exact boundary changes by source, age group, population, and measurement method. Use the chart to understand context, then use a consistent measurement method and several signals to follow your own trend.
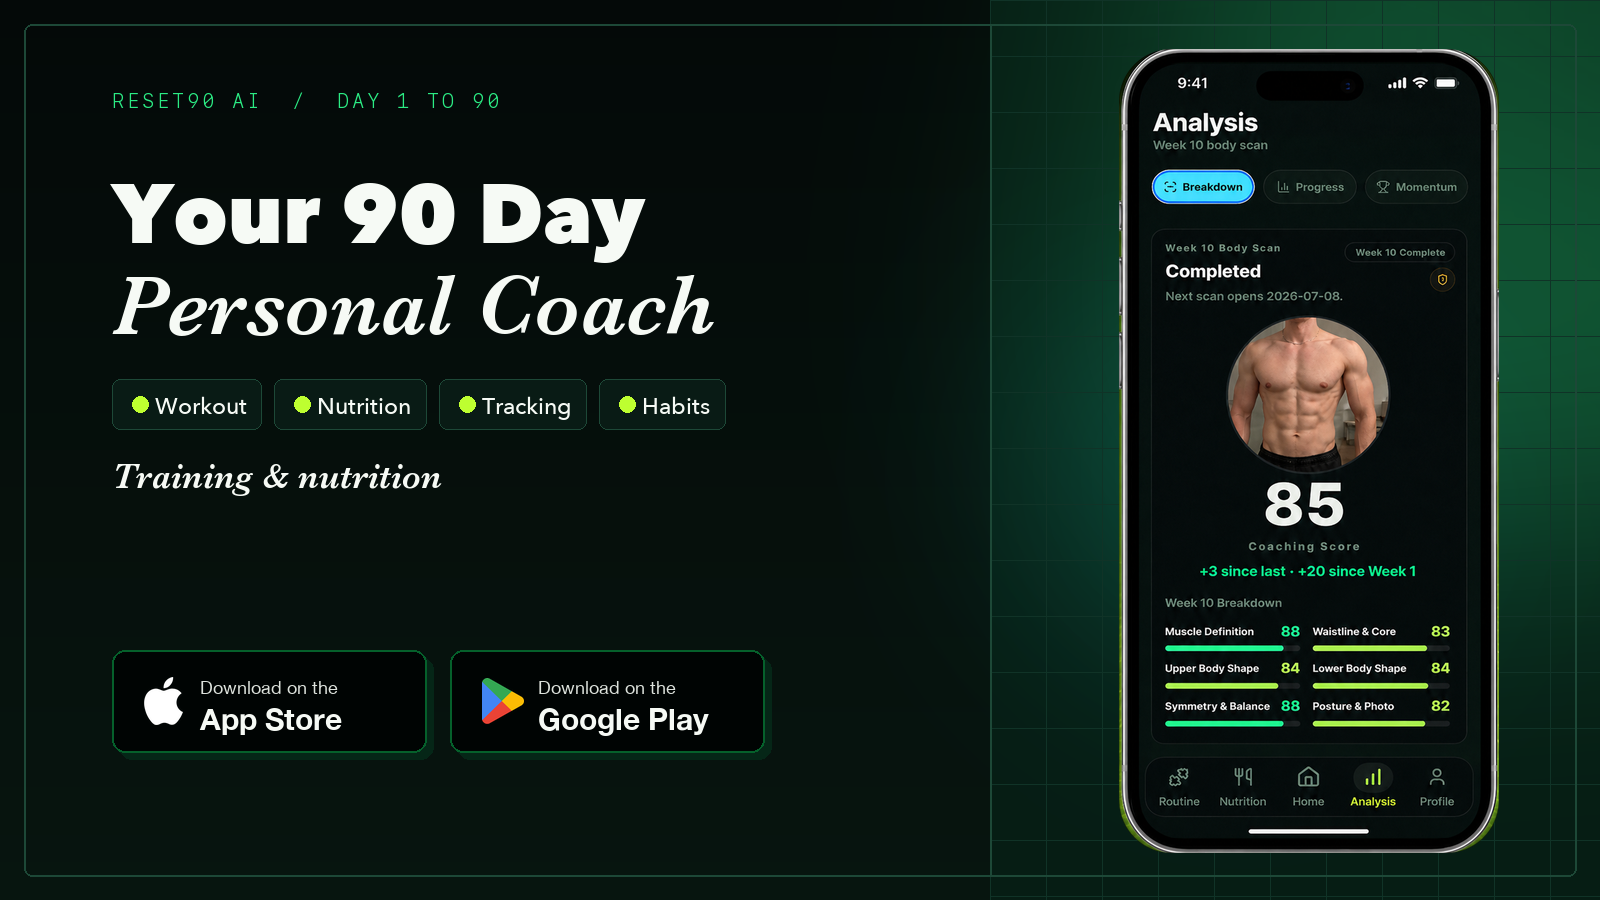
If you are trying to make sense of a smart-scale reading, a visualizer, or a recent body-composition assessment, start with the same question: What does this number mean, and how much confidence should I place in it? That is more useful than asking whether one percentage is automatically “good.”
01Body fat percentage chart: the quick reference
The table below uses a familiar adult, ACE-style category layout. It is useful for orientation because it shows why the same number can be interpreted differently for men and women. It is not a clinical classification system, and the labels are not instructions to chase the lowest possible number.
| Reference category | Adult men | Adult women | What it means |
|---|---|---|---|
| Essential fat | 2–5% | 10–13% | A minimum physiological range; not a general fitness target. |
| Athlete | 6–13% | 14–20% | A broad sport-related reference band; sport, genetics, and season matter. |
| Fitness | 14–17% | 21–24% | A commonly used fitness reference band, not a promise about health or appearance. |
| Average | 18–24% | 25–31% | A general population reference band; “average” does not mean ideal or unhealthy. |
| Above this reference | 25%+ | 32%+ | Above this source’s reference boundary; not a diagnosis by itself. |
Two cautions matter here. First, the boundaries are rounded reference points, not sharp biological switch points. A reading of 24.8% and a reading of 25.1% do not represent a meaningful overnight change in health. Second, “essential,” “athlete,” “fitness,” and “average” describe how a chart is organized. They do not tell you what your body should look like, how much you should weigh, or what your next goal must be.
02Why body fat percentage ranges differ by age
Body composition usually changes across adulthood. On average, fat mass tends to rise with age while lean mass, activity, hormones, and training history can change in different directions. That is why a chart built around one adult age group may not be the best context for someone in another group.
Some age-banded reference systems present ranges like the example below:
| Age band | Men: example reference range | Women: example reference range |
|---|---|---|
| 20–39 | 8–19% | 21–32% |
| 40–59 | 11–21% | 23–33% |
| 60–79 | 13–24% | 24–35% |
Notice that this table does not line up perfectly with the category table above. That is expected. One chart may be based on a category framework, while another may describe a healthy population range, percentiles, or an age-specific reference dataset. They answer related but different questions.
For a deeper explanation of what changes with age, read our guide to average body fat percentage by age. Treat “average” as a description of a population, not as a required endpoint for an individual. Your training history, muscle mass, ethnicity, sex, age, health history, and how the measurement was collected can all affect where a useful comparison sits.
03How to read a body fat percentage chart
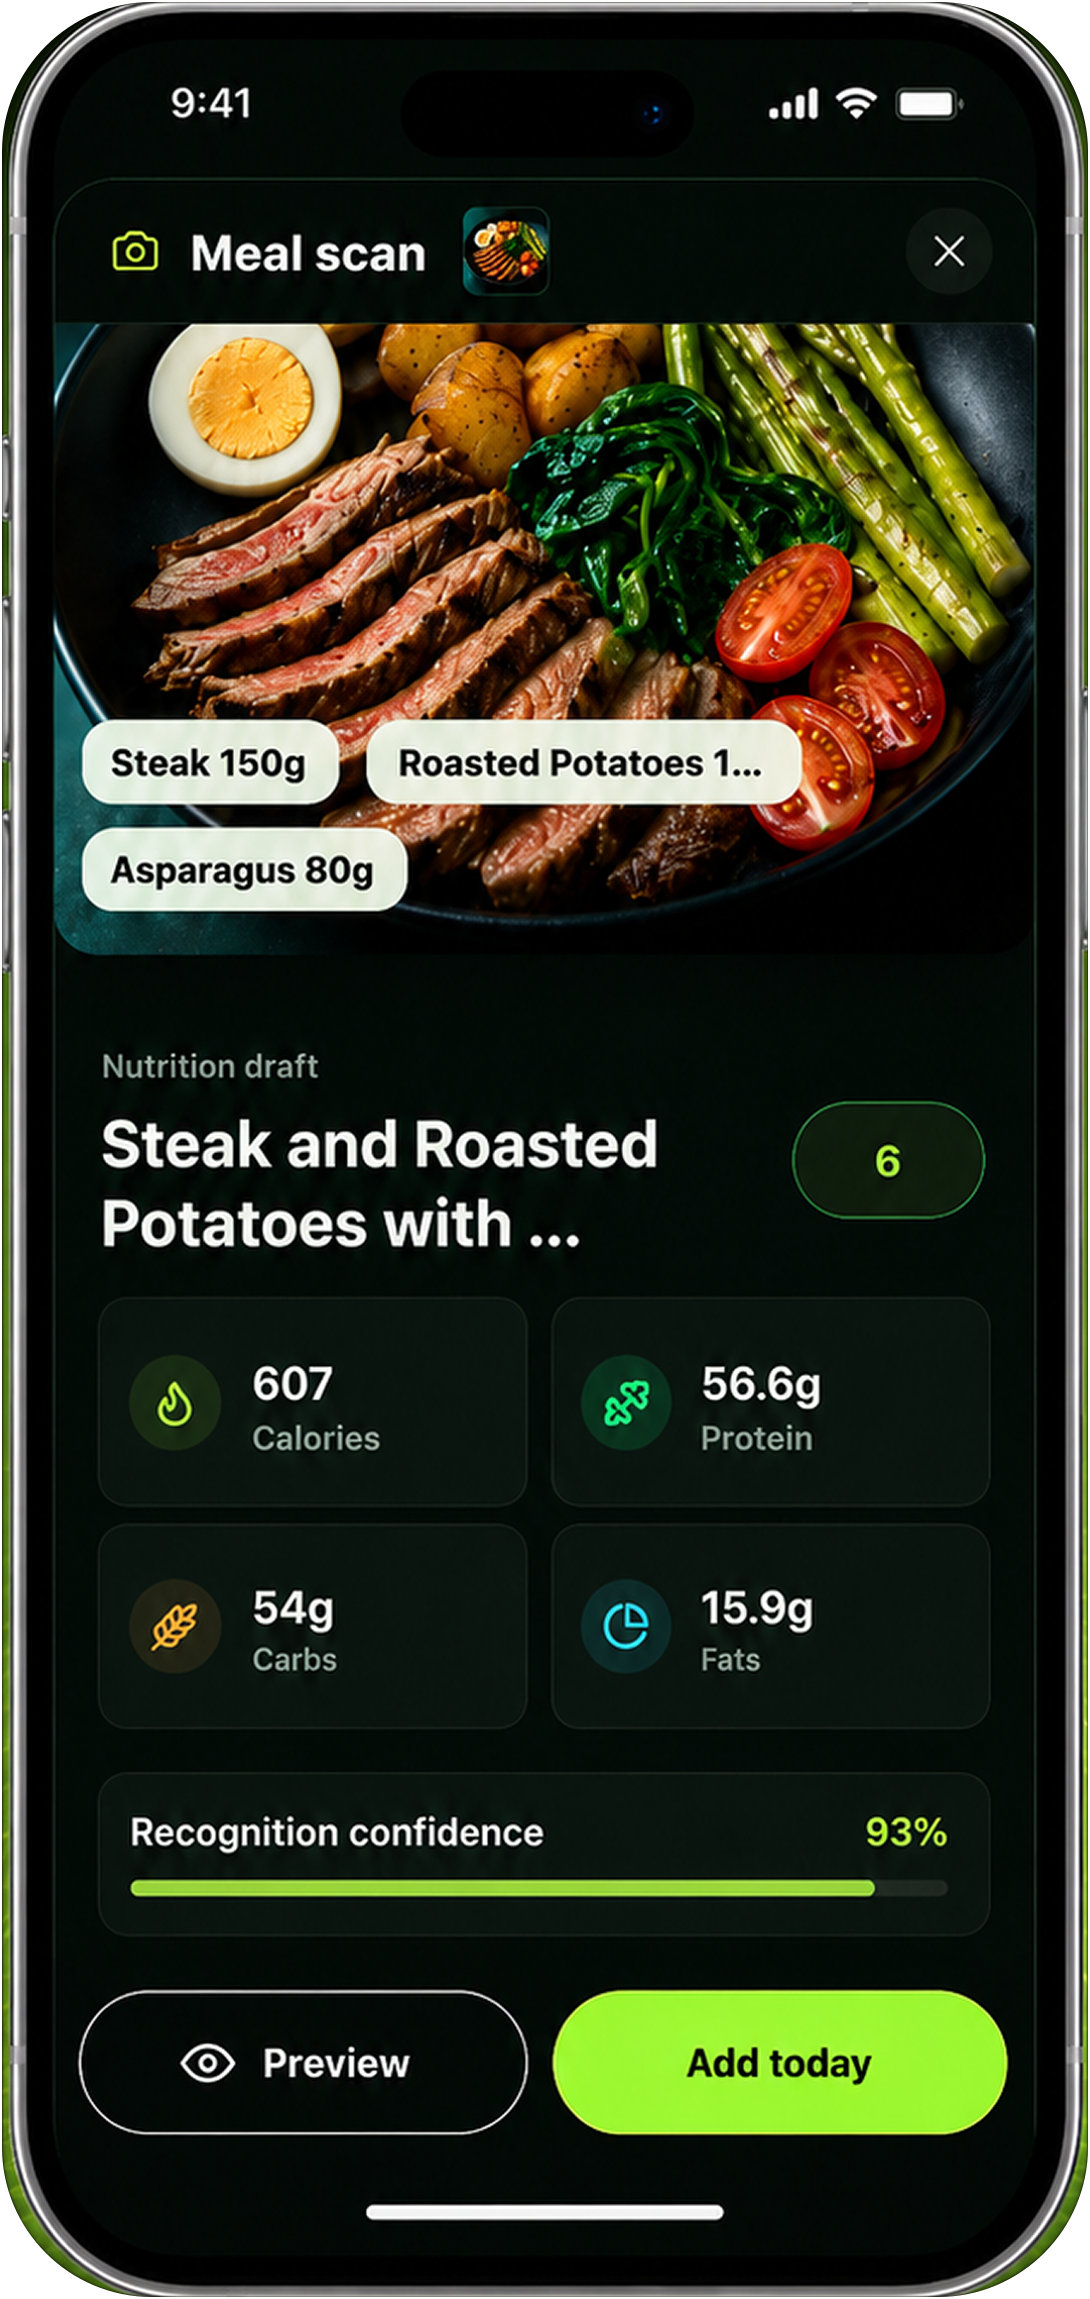
When you find a chart online, use this four-question check before comparing yourself with it:
- What population does it describe? Check the age range, sex category, country or sample, and whether it describes athletes, a general population, or a clinical group.
- What does each label mean? “Healthy,” “acceptable,” “average,” “fitness,” and “athlete” are not interchangeable. A chart’s label may reflect a statistical boundary rather than a medical recommendation.
- How was body fat measured? A DEXA-based reference and a consumer BIA scale are not interchangeable rulers. A difference between them may reflect the method, not a real change in your body.
- Is the number being used as context or as a verdict? A chart can help you ask better questions. It cannot diagnose a condition, predict your exact health risk, or tell you how you should look.
This is also why body fat percentage and BMI should not be treated as competing scores where one always wins. Body fat percentage vs. BMI is a question about different measurements: body fat percentage estimates the share of mass that is fat, while BMI uses height and weight and does not distinguish fat, muscle, bone, or fat distribution. Each has limitations, and the useful choice depends on the question you are trying to answer.
04What the measurement method can and cannot tell you
A body fat percentage is an estimate. Even methods that are useful in research or clinical settings have assumptions, device variation, and measurement error. The practical goal is not to find a magically perfect reading; it is to understand the method well enough to avoid false precision.
| Method | Useful for | Main limitation | Best tracking habit |
|---|---|---|---|
| Smart scale or BIA | Convenient repeated estimates | Hydration, meals, skin temperature, foot contact, and the device equation can shift the result. | Use the same device under similar conditions and follow the trend. |
| Skinfold calipers | Low-cost field estimates | Site selection, pinching technique, and the chosen equation matter. | Use the same trained tester and protocol. |
| DEXA | A more detailed body-composition assessment | Cost, access, machine differences, and the fact that it is still an estimate. | Compare follow-up scans with the same service and similar conditions. |
| Hydrostatic weighing or Bod Pod | Density-based assessment in a controlled setting | Less convenient and dependent on assumptions about body composition. | Use the same method if you repeat the assessment. |
Smart scales can be useful for tracking, but that is different from claiming that every individual reading is accurate to a decimal place. If you are deciding whether a home reading is worth using, our guide to smart-scale accuracy explains why consistency often matters more than the absolute number.
05How to track a body fat percentage trend
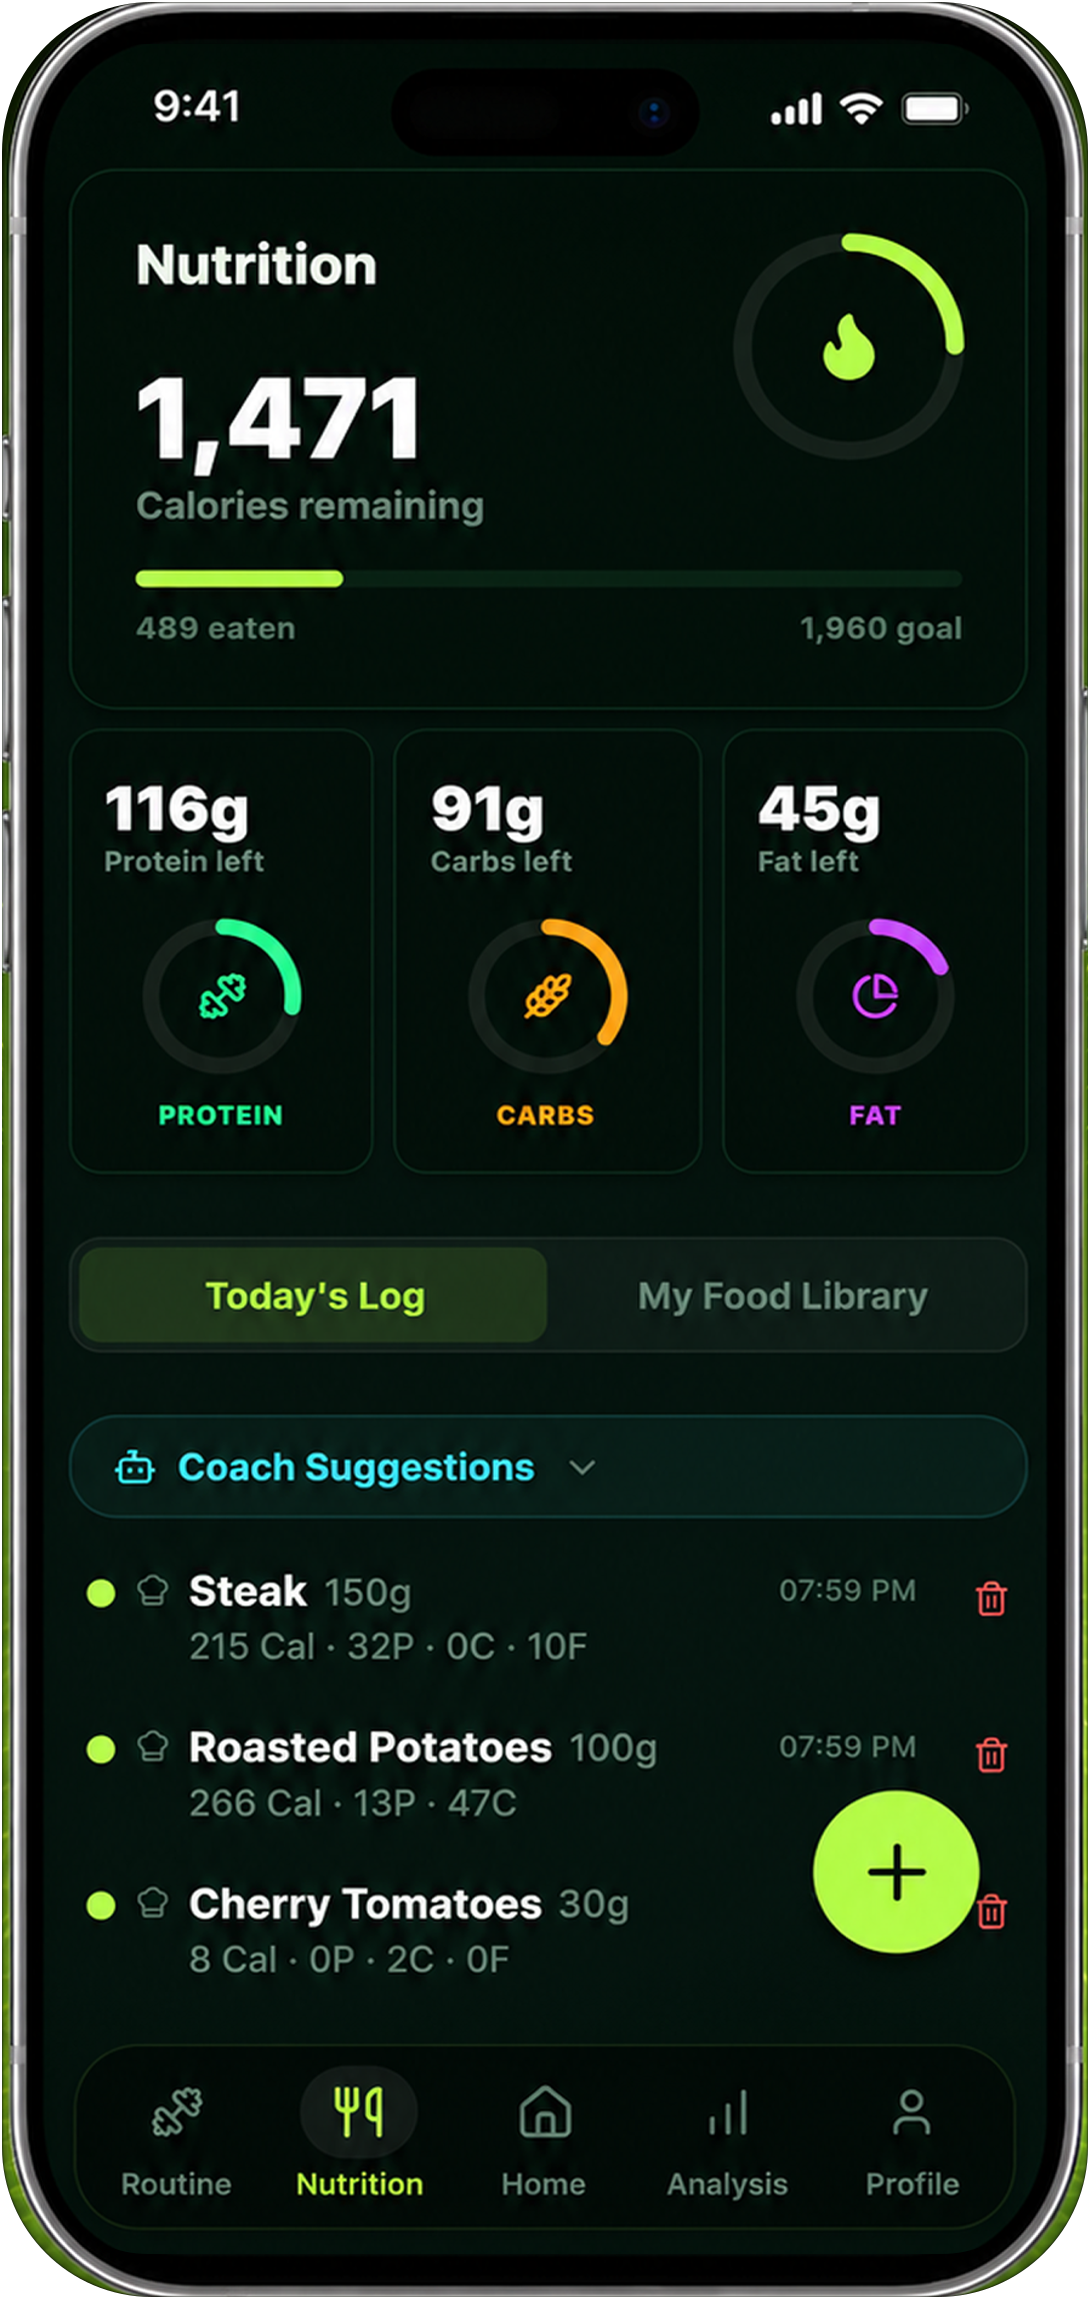
The most useful question is usually not “What is my exact body fat today?” It is “Is the direction of my measurements consistent with my plan over the last few weeks?” A simple 28-day process can make the chart more useful:
- Choose one primary method. Pick a home scale, calipers, or a professional assessment. Do not switch between BIA, DEXA, and a visual estimate and treat the outputs as one continuous line.
- Standardize the conditions. Measure at a similar time, before or after similar food and fluid intake, and under the device’s recommended conditions. Write down anything unusual, such as travel, a hard training session, or dehydration.
- Collect enough readings to see noise. If you measure often, look at a weekly average or median instead of reacting to one result. If you measure weekly, keep the weekday and routine consistent.
- Pair the number with other signals. Track body-weight averages, waist or other measurements, progress photos under similar lighting, workout performance, recovery, and how your clothes fit. A single percentage cannot describe all of those changes.
- Review after four weeks. Ask whether the trend, training, nutrition, and recovery are moving in a direction you can sustain. If the number is changing but performance, energy, or wellbeing is deteriorating, that is a reason to reconsider the plan, not celebrate a lower reading automatically.
For a practical measurement protocol, see how to take body measurements. The key is repeatability: the same tool, the same routine, and enough time between reviews to separate a real trend from hydration or digestion.
06How Reset90 fits into body-composition tracking
Reset90 is useful for tracking the behaviors and signals that influence body composition, not for pretending that a phone camera or one body-fat estimate can replace a clinical assessment. You can use it to keep your workouts, nutrition targets, check-ins, weight, measurements, and progress photos in one routine.
That matters because a body-fat chart gives you context, while a habit system gives you a way to act on context. You might use the body-fat visualizer to understand how different ranges are represented, then use your actual measurements and weekly trend to decide whether your current training and nutrition plan is working. The visualizer is educational; it is not a measurement device.
If your goal is body recomposition, combine the chart with a body-recomposition tracking approach: look for stable or improving performance, a sensible waist trend, consistent nutrition, and progress photos over time. The strongest signal is usually a pattern across several weeks, not a single percentage.
07Frequently asked questions
What is a good body fat percentage?
There is no single number that is “good” for every adult. A common reference chart lists different ranges for men and women, and age-specific references can shift those ranges. Use the chart as context alongside your measurement method, health history, performance, and goals. A clinician can help interpret a result when the question is medical rather than fitness-related.
Is 20% body fat healthy?
It depends on the person and the reference system. In a common ACE-style chart, 20% falls near the upper end of the athletic band for men and near the athletic or fitness boundary for women. That does not establish health, and it does not tell you whether the estimate itself is reliable. Check the method, the trend, and the rest of the picture.
Does body fat percentage increase with age?
It often increases on average, but individual trajectories vary. Activity, resistance training, muscle mass, nutrition, hormones, health conditions, and measurement method all matter. Age-banded charts are useful because they provide context, not because they create a required target for every person.
Can a smart scale accurately measure body fat?
A smart scale can provide a useful estimate for repeated tracking, but the reading is sensitive to conditions and device equations. Treat it as a trend signal. Keep your routine consistent, avoid comparing it directly with a different method, and use waist, photos, body weight, and performance as supporting signals.
Should I try to reach the lowest range on the chart?
No. The lowest category is not automatically the healthiest or most sustainable place to be. Essential-fat ranges are physiological boundaries, not general-purpose goals. If reducing body fat is part of your plan, use a gradual, sustainable approach and pay attention to energy, recovery, training performance, mood, and medical context.
08The bottom line
A body fat percentage chart is most useful when it answers a narrow question: “What kind of reference range might this estimate sit in?” It becomes misleading when it is used as a diagnosis, an attractiveness score, or a command to keep cutting.
Read the source, age band, category definitions, and measurement method. Then track your own trend with consistent conditions and multiple signals. That gives you a more honest picture than chasing a single number that may move because of water, food, device assumptions, or a different testing method. If you have symptoms, are pregnant, have a history of disordered eating, have unexplained weight change, or need to make a clinical decision, speak with a qualified healthcare professional.
The Reset90 system
Useful ideas for building a body you can keep.
Training notes, product updates, and practical ways to make your next 90 days count.
Start your next 90 days
Get your daily training, nutrition, and check-in priorities in one adaptive system.


Keep reading
Related articles
Ideal Body Measurements for Women
There is no single ideal body measurement set for women. Learn how averages, waist-to-height, body shape and repeatable tracking fit together without chasing a fixed beauty standard.
Read article
Bulk, Cut, or Recomp? A Practical Decision Guide
A practical way to choose a bulk, cut, recomp, or maintenance phase using your goal, training age, recovery, and repeatable progress signals.
Read article
How Often Should You Take Progress Photos?
How often should you take progress photos? Use this goal-based guide to choose weekly, biweekly, or monthly check-ins and make every comparison more consistent.
Read article