

Skeletal Muscle Mass Percentage by Age and Sex
Learn what skeletal muscle mass percentage means, how age and sex affect reference ranges, why smart-scale numbers vary, and how to track the trend safely.
By Reset90 AI Editorial Team
Short answer: Skeletal muscle mass percentage is the estimated share of your body weight made up by skeletal muscle. Commonly cited reference bands are higher for men than women and tend to decline with age, but there is no single official “good” number that applies to everyone. The result also depends on how it was measured: a smart scale, InBody-style device, DEXA scan, and MRI are not reporting exactly the same thing. Use an age-and-sex chart for context, then judge your own trend on the same device and under similar conditions.

If a scale says your skeletal muscle mass is 38%, it is natural to ask whether that is good, low, or worth changing. The difficult part is that “muscle percentage” is not one universal laboratory measurement. Different devices use different definitions, algorithms, reference populations, and labels.
That does not make the number meaningless. It means the number needs a translation guide. This article explains what skeletal muscle mass percentage means, how age and sex change the reference context, why smart-scale readings move, and how to track the signal without turning a population chart into a diagnosis or an ideal-body target.
01What does skeletal muscle mass percentage mean?
Skeletal muscle is the muscle attached to your bones that you can voluntarily contract to move, stabilize, and produce force. Skeletal muscle mass percentage, often abbreviated SMM%, tries to express the estimated mass of that tissue as a percentage of total body weight:
SMM% = estimated skeletal muscle mass ÷ body weight × 100
The word “estimated” matters. A home scale does not weigh each muscle separately. It senses body weight and electrical impedance, then uses an equation that may also include your height, age, sex, and other profile inputs. An InBody-style printout may use more electrodes and segmental measurements, but its skeletal-muscle field is still a model output.
Do not confuse these terms:
| Term | What it generally describes | Why the distinction matters |
|---|---|---|
| Skeletal muscle mass | Voluntary muscle attached to the skeleton. | This is the tissue most relevant to strength and movement, but consumer devices estimate it. |
| Lean body mass | Everything that is not body fat, including muscle, water, bone, organs, and connective tissue. | Lean mass is not the same as skeletal muscle. Water can move lean mass quickly. |
| Fat-free mass index (FFMI) | Fat-free mass adjusted for height, usually expressed in kg/m². | FFMI is a height-normalized index, not a percentage of body weight. See the FFMI chart by age and gender for that separate metric. |
| Skeletal muscle index | Often an appendicular muscle-mass measure adjusted for height. | It is used in clinical and research contexts and should not be casually converted into SMM%. |
One device may display “skeletal muscle,” another “muscle mass,” and another “lean mass.” Those labels are not automatically interchangeable. Before comparing a result with an online chart, check what the device says it is estimating and what units or denominator it uses.
02Skeletal muscle mass percentage by age and sex
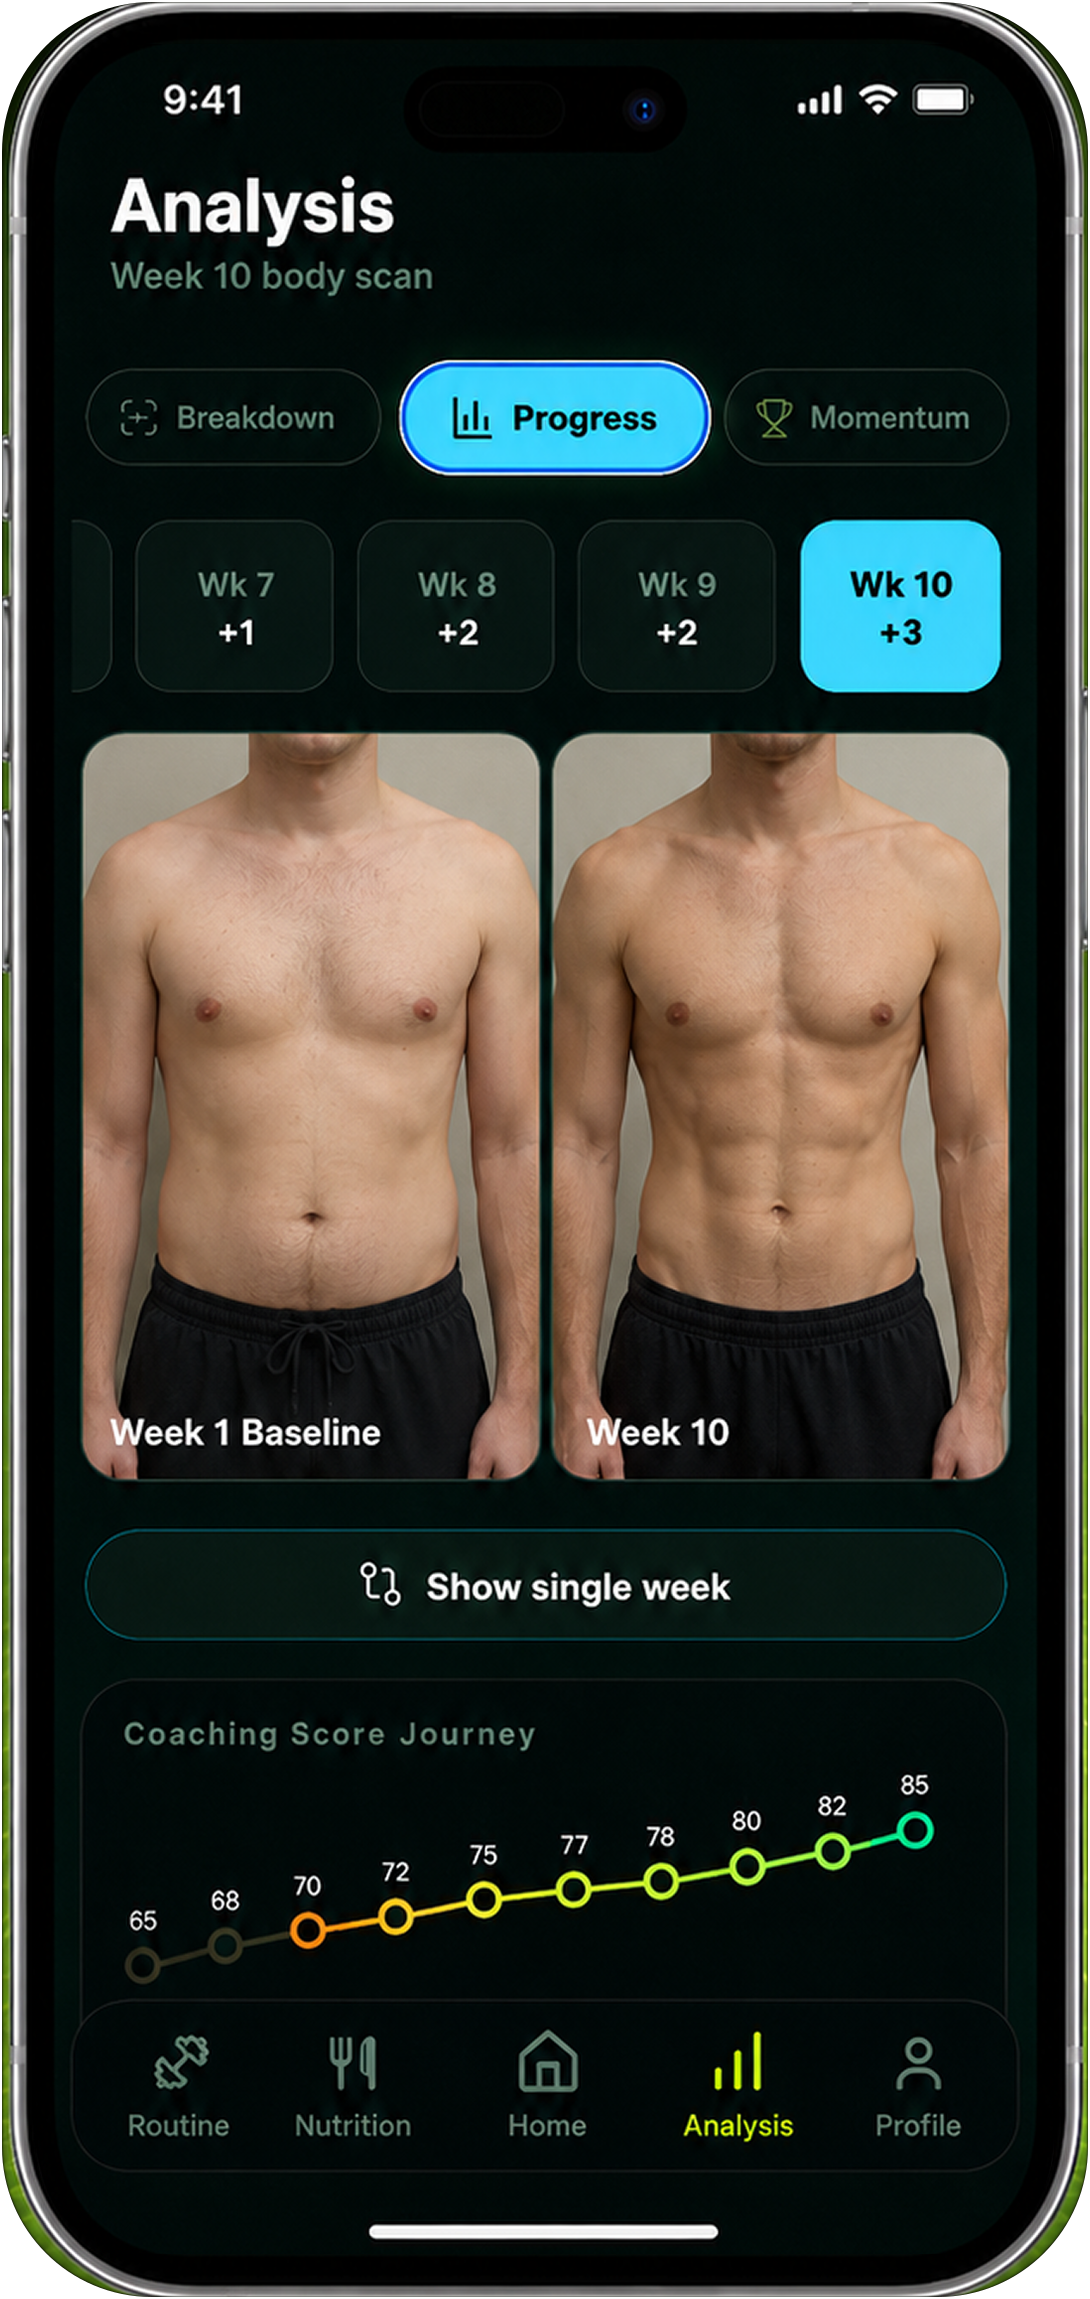
The table below is a reference, not a pass/fail standard. It summarizes commonly cited whole-body skeletal-muscle percentage bands from an MRI reference cohort of adults. The ranges are useful for showing the broad pattern: male averages are generally higher, female values are generally lower, and the percentage tends to decrease across older age groups.
| Age | Men: skeletal muscle percentage | Women: skeletal muscle percentage |
|---|---|---|
| 18–35 | About 40%–44% | About 31%–33% |
| 36–55 | About 36%–40% | About 29%–31% |
| 56–75 | About 32%–35% | About 27%–30% |
| 76–85 | Below about 31% | Below about 26% |
These values should be read as broad population context, not as universal healthy cutoffs. A table built from whole-body MRI is not automatically interchangeable with a smart-scale table built from BIA, and a chart for “muscle mass” may actually refer to lean mass. Even when two sources use the same percentage sign, they may not be measuring the same construct.
03Why do men and women have different reference ranges?
On average, men and women have different body-composition distributions, including differences in skeletal muscle mass relative to body weight. That is why a reference table usually separates the sexes instead of applying one universal percentage band.
A lower population average for women does not mean that women are less capable, less healthy, or supposed to chase the male range. Strength depends on more than a percentage: body size, leverage, training history, skill, muscle distribution, energy availability, and the task being performed all matter.
Age adds another layer. Muscle mass and muscle function are influenced by resistance training, activity, protein intake, illness, recovery, hormones, and long periods of inactivity. A population study can show an average age pattern without predicting the exact path of any individual. Someone who trains consistently may differ from a sedentary person of the same age, while two people with the same percentage may have different strength and health contexts.
04Is 40% skeletal muscle good?
It depends on what measured it and what question you are asking. In a whole-body reference chart, 40% may sit near the upper end for some adult men and above the typical range shown for many women. On a consumer scale, however, 40% may represent a device-specific estimate that cannot be placed directly on that chart.
“Good” also has at least three meanings:
- Reference: Is the number similar to a population band produced by the same type of method?
- Function: Can you perform daily activities and training tasks with the strength, balance, and capacity you want?
- Direction: Is your number stable or changing in a way that matches your training and nutrition goal under repeatable conditions?
A single percentage cannot answer all three. It also cannot diagnose sarcopenia, determine metabolic health, or prove that a person needs to gain or lose muscle. If you have symptoms, rapid unexplained change, weakness, repeated falls, swelling, or a medical concern, discuss it with a qualified healthcare professional.
05Where does the number come from?
There are several ways to estimate or assess muscle mass. Each method answers a slightly different question and carries its own tradeoffs.
| Method | Useful for | Main limitation |
|---|---|---|
| Smart scale or BIA | Frequent, convenient trend tracking at home. | Hydration, food, exercise, skin contact, temperature, posture, and equations can change the estimate. |
| InBody-style BIA | More detailed segmental estimates under a standardized protocol. | Still model-based; results depend on the device, protocol, and reference equations. |
| DEXA | Regional lean tissue, bone mineral, and fat estimates in a clinical or sports setting. | It is not a direct photograph of every skeletal muscle and is not perfectly interchangeable with BIA or MRI. |
| MRI | Detailed research or specialist assessment of muscle volume and distribution. | Cost, access, time, and specialist interpretation make it impractical for routine tracking. |
| Strength, circumference, and photos | Practical evidence about function, size, and visible change. | These signals do not directly measure total skeletal muscle mass. |
Research using large populations can still make BIA useful for reference work, especially when testing conditions are standardized. That does not mean a BIA percentage is a precise personal measurement. It means the method may detect patterns at the group level and provide a practical signal when you repeat it consistently.
06Why smart-scale muscle percentage changes
BIA estimates are sensitive to the electrical properties of your body, which are influenced by water distribution. A hard workout, a salty meal, alcohol, a large carbohydrate intake, dehydration, a hot shower, or simply measuring at a different time can change the inputs to the equation.
That is why a higher muscle percentage tomorrow does not automatically mean you built muscle overnight. Likewise, a lower reading after a sweaty workout does not automatically mean you lost contractile tissue. If your scale reports weight, body fat, water, muscle, and bone together, treat them as related model outputs rather than five independent laboratory measurements.
For a more detailed explanation of this issue, read are smart scales accurate for body fat and muscle? The practical rule is simple: do not compare a fasted morning reading from one brand with a post-workout evening reading from another brand and call the difference a body-composition change.
07How to track skeletal muscle mass percentage without overreacting
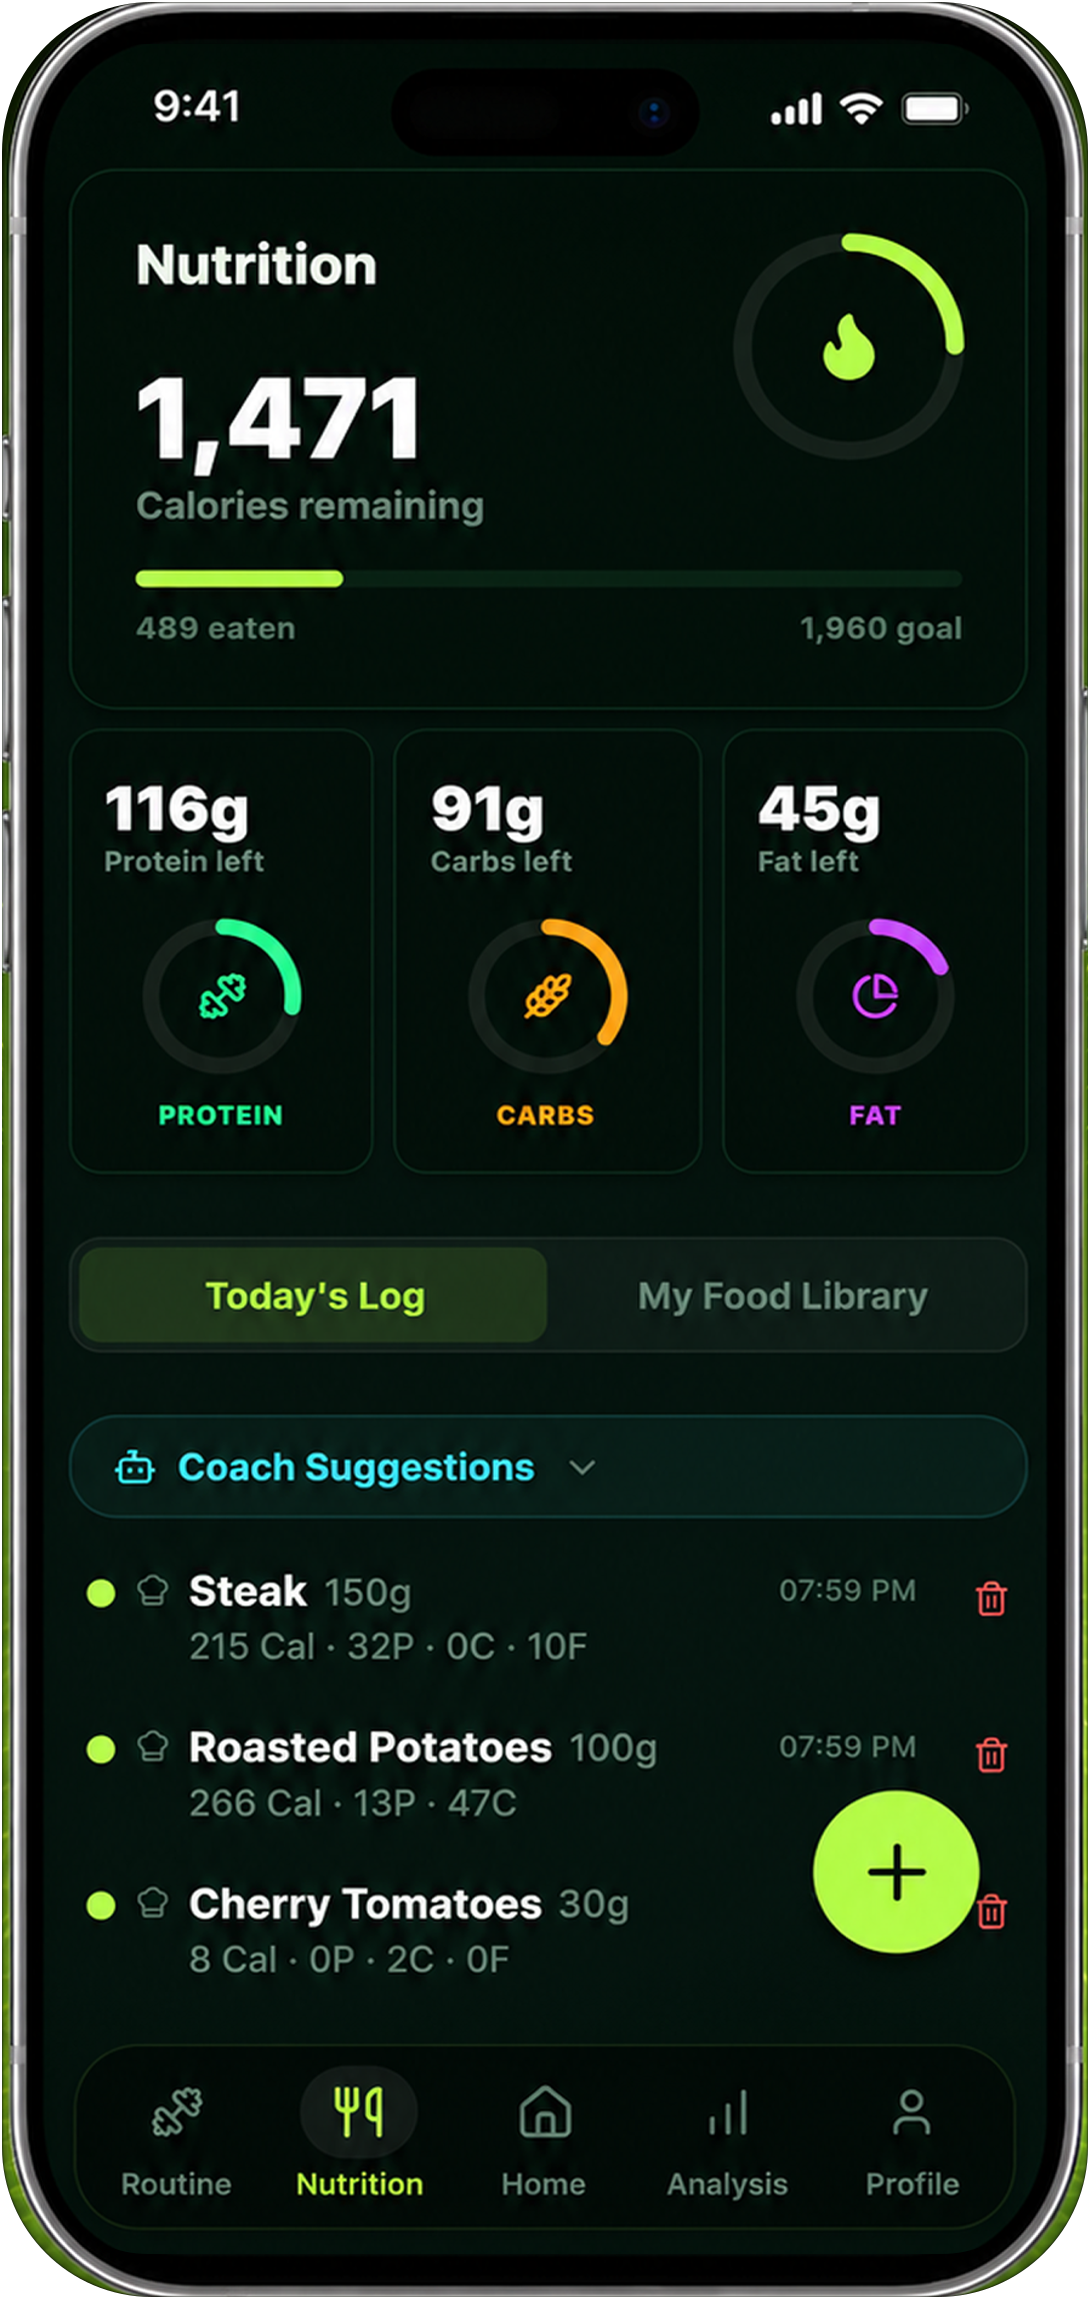
Use a fixed protocol and a long enough review window. A useful starting routine is to measure every one to four weeks, depending on how often the device is available, rather than reacting to every daily estimate.
- Choose one device and definition. Record whether the number comes from a smart scale, BIA machine, DEXA report, or another method.
- Standardize the conditions. Keep the time of day, hydration pattern, pre-measurement meal, exercise gap, clothing, and foot contact as similar as practical.
- Log supporting signals. Add body weight, waist measurement, progress photos, key lifts, repetitions, and a short note about unusual sleep, illness, travel, or training.
- Review a 28-day pattern. Ask whether the direction is consistent and whether it makes sense alongside strength, measurements, and performance.
- Change one variable at a time. Do not change calories, training volume, and measurement devices because of one noisy result.
A simple interpretation matrix can help:
| Pattern over several weeks | Reasonable interpretation | Next step |
|---|---|---|
| SMM% stable, strength improving, waist stable | The plan may be supporting performance even if the percentage is unchanged. | Keep the protocol and continue reviewing monthly. |
| SMM% down once, after a different routine | Measurement conditions may explain the shift. | Repeat under normal conditions before making a plan change. |
| SMM% and strength trend down with poor recovery | The broader pattern deserves attention; the scale alone cannot identify the cause. | Review training, nutrition, sleep, illness, and professional guidance if needed. |
| SMM% rises while weight and waist also rise quickly | Some of the scale change may be water, fat, or equation noise rather than new muscle. | Review the full trend and intake; do not credit the percentage alone. |
08What to track alongside the percentage
The best companion signals depend on your goal. If you are trying to gain muscle, track training performance, exercise quality, body weight trend, protein consistency, recovery, and a few circumferences. If you are losing fat while trying to maintain muscle, use waist, photos, strength, weight averages, and nutrition adherence together.
For waist measurements, use one documented landmark and the same tape tension each time. For photos, keep the camera distance, lighting, pose, and clothing consistent. For strength, compare the same exercise with similar technique instead of chasing an unrelated personal record. These signals are not substitutes for a clinical scan, but they make a home trend more interpretable.
The body-fat percentage chart and average body-fat percentage by age can provide adjacent context, but do not combine their ranges with an SMM% chart as though they were one score. Body fat, skeletal muscle, lean mass, and FFMI answer different questions.
09How Reset90 fits into the picture
Reset90 can help organize the surrounding evidence: workouts, nutrition targets, check-ins, weight trends, measurements, progress photos, and the notes that explain unusual readings. That context is useful because a muscle percentage without the conditions around it is easy to overinterpret.
Use a check-in to record the same device, approximate timing, recent training, and the signals that matter for your goal. Then review the pattern over several weeks instead of trying to make a daily percentage look better. Reset90 provides coaching and tracking context; it does not clinically measure skeletal muscle mass, diagnose sarcopenia, or replace a qualified professional assessment.
If you want to understand how a body-composition number relates to another metric, the body-fat percentage versus BMI guide explains why relevance and measurement accuracy are separate questions. The goal is not to collect the most numbers. It is to use a small, consistent set of signals that helps you make calmer decisions.
10Frequently asked questions
What is a healthy skeletal muscle mass percentage?
There is no single official percentage that defines healthy for every adult. Common reference tables often show roughly 40%–44% for younger men and 31%–33% for younger women, with lower bands at older ages, but the method and population behind the table matter. Use the values as context, not as a diagnosis or universal target.
Is 40% skeletal muscle good for a woman?
You cannot answer that responsibly from the percentage alone. First identify the device and definition. Some consumer outputs are not directly comparable with whole-body skeletal-muscle reference data, and a high value may reflect the equation or measurement conditions. Strength, function, health context, and a repeatable trend are more useful than a single cutoff.
Does skeletal muscle percentage decrease with age?
Population studies generally show age-related declines in muscle-mass parameters, but the size and timing vary across populations and measurement methods. Resistance training, physical activity, nutrition, recovery, illness, and long periods of inactivity can all influence an individual trajectory.
Is skeletal muscle mass the same as lean body mass?
No. Lean body mass includes skeletal muscle plus water, bone, organs, connective tissue, and other non-fat components. A device can show a quick lean-mass change because body water moved; that is not proof that skeletal muscle was built or lost at the same speed.
Should I compare my percentage with a different smart scale?
Usually not. Different brands may use different electrodes, equations, profile inputs, and labels. For personal progress, the same device under similar conditions is generally more interpretable than comparing two brands. If a clinical decision matters, ask a qualified professional which method fits the question.
What should I do if my number is unexpectedly low?
Repeat the measurement under your normal protocol and check whether the device, profile, hydration, food, exercise, and timing changed. Then look at strength, function, weight trend, waist, and photos. If the change is rapid, unexplained, accompanied by symptoms or weakness, or causing significant distress, seek qualified medical guidance rather than trying to fix it with an aggressive diet or training change.
11The bottom line
Skeletal muscle mass percentage can be a useful body-composition reference, but it is not a universal score. Age and sex change the population context, while the measurement method changes what the number actually represents. A whole-body MRI reference band, an InBody estimate, a smart-scale output, and an FFMI chart should not be blended together casually.
Use an age-and-sex table to ask better questions, not to label yourself. Record the same device and conditions, review a 28-day trend, and add strength, waist, photos, weight, and recovery context. The most useful result is not the one with the most precise-looking decimal. It is the one you can interpret honestly and consistently over time.
The Reset90 system
Useful ideas for building a body you can keep.
Training notes, product updates, and practical ways to make your next 90 days count.
Start your next 90 days
Get your daily training, nutrition, and check-in priorities in one adaptive system.


Keep reading
Related articles
Ideal Body Measurements for Women
There is no single ideal body measurement set for women. Learn how averages, waist-to-height, body shape and repeatable tracking fit together without chasing a fixed beauty standard.
Read article
Bulk, Cut, or Recomp? A Practical Decision Guide
A practical way to choose a bulk, cut, recomp, or maintenance phase using your goal, training age, recovery, and repeatable progress signals.
Read article
How Often Should You Take Progress Photos?
How often should you take progress photos? Use this goal-based guide to choose weekly, biweekly, or monthly check-ins and make every comparison more consistent.
Read article